Getting Started
Build Monte Carlo simulations using a visual canvas. Connect blocks, define distributions, and run thousands of scenarios—no coding required.
Overview
Monte Carlo simulation runs thousands of random samples to reveal the full range of possible outcomes. Instead of a single estimate like "the project costs $100,000," you see a distribution: there's a 90% probability the cost falls between $85,000 and $120,000.
Block Palette
The palette in the top-left corner contains all block types. Click to add at center, or drag to place anywhere on the canvas.
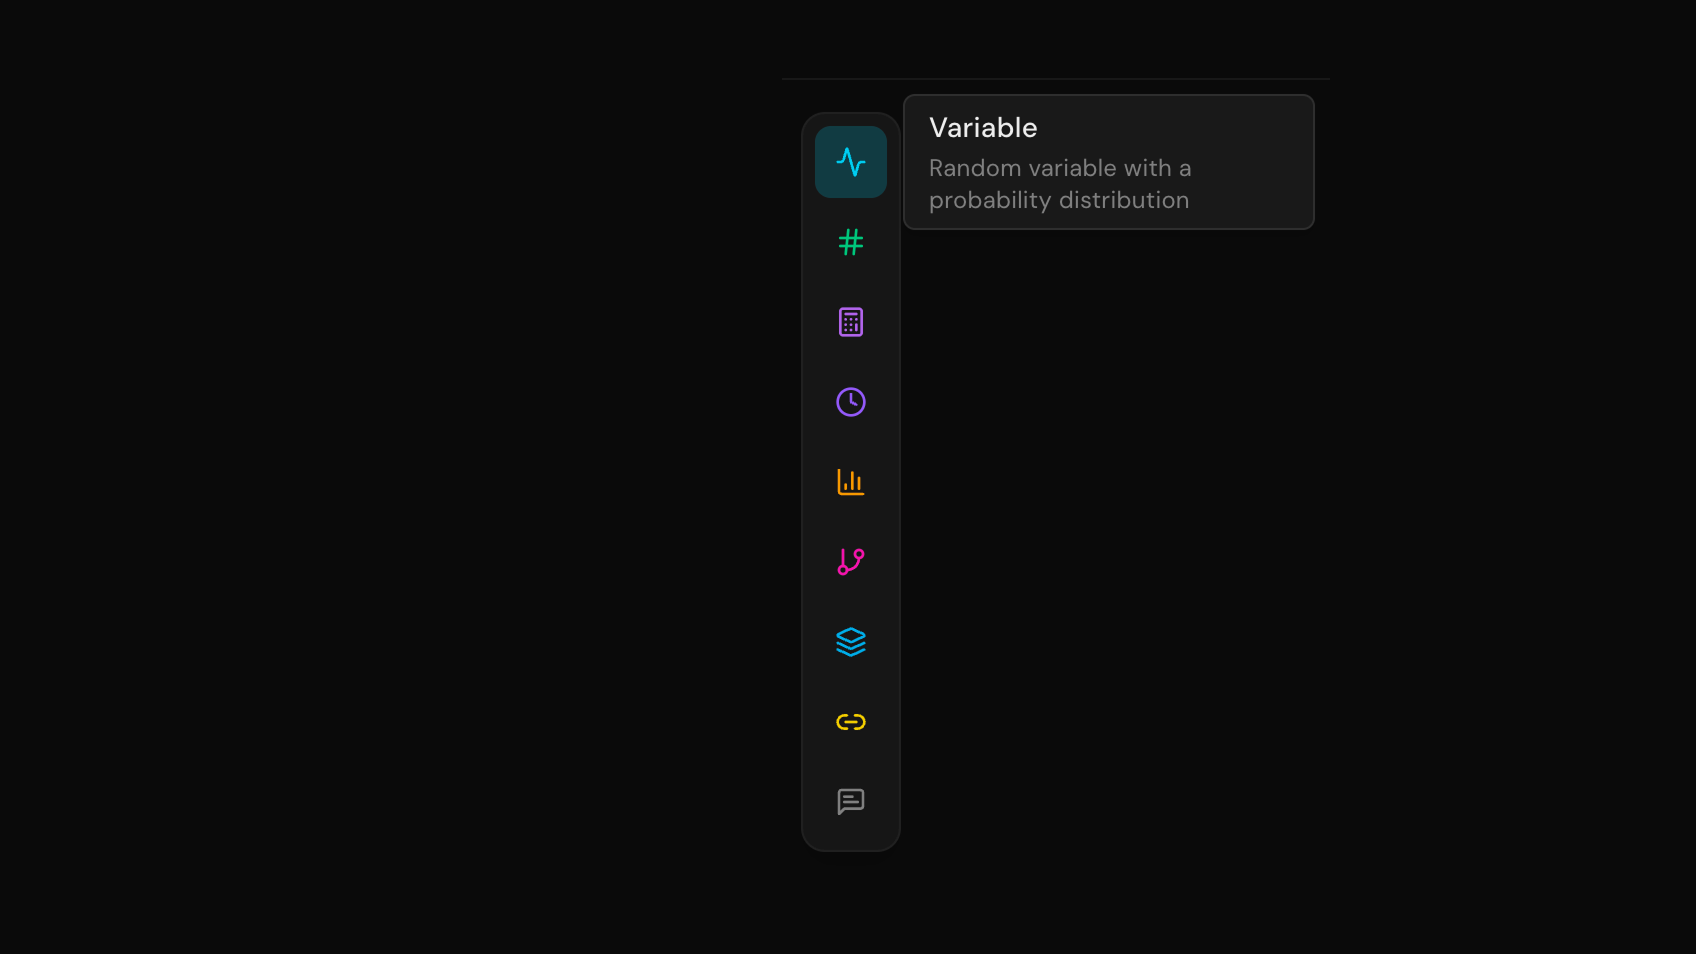
Variable blocks model uncertain inputs with probability distributions.Constant blocks hold fixed values.Formula blocks combine inputs with mathematical expressions.Output blocks collect results to display in the results panel.
Advanced blocks include Decision for conditional branching,Aggregator for combining multiple values (sum, average, min, max),Copula for modeling correlated variables, andTime Series for values that evolve over time.
Workflow
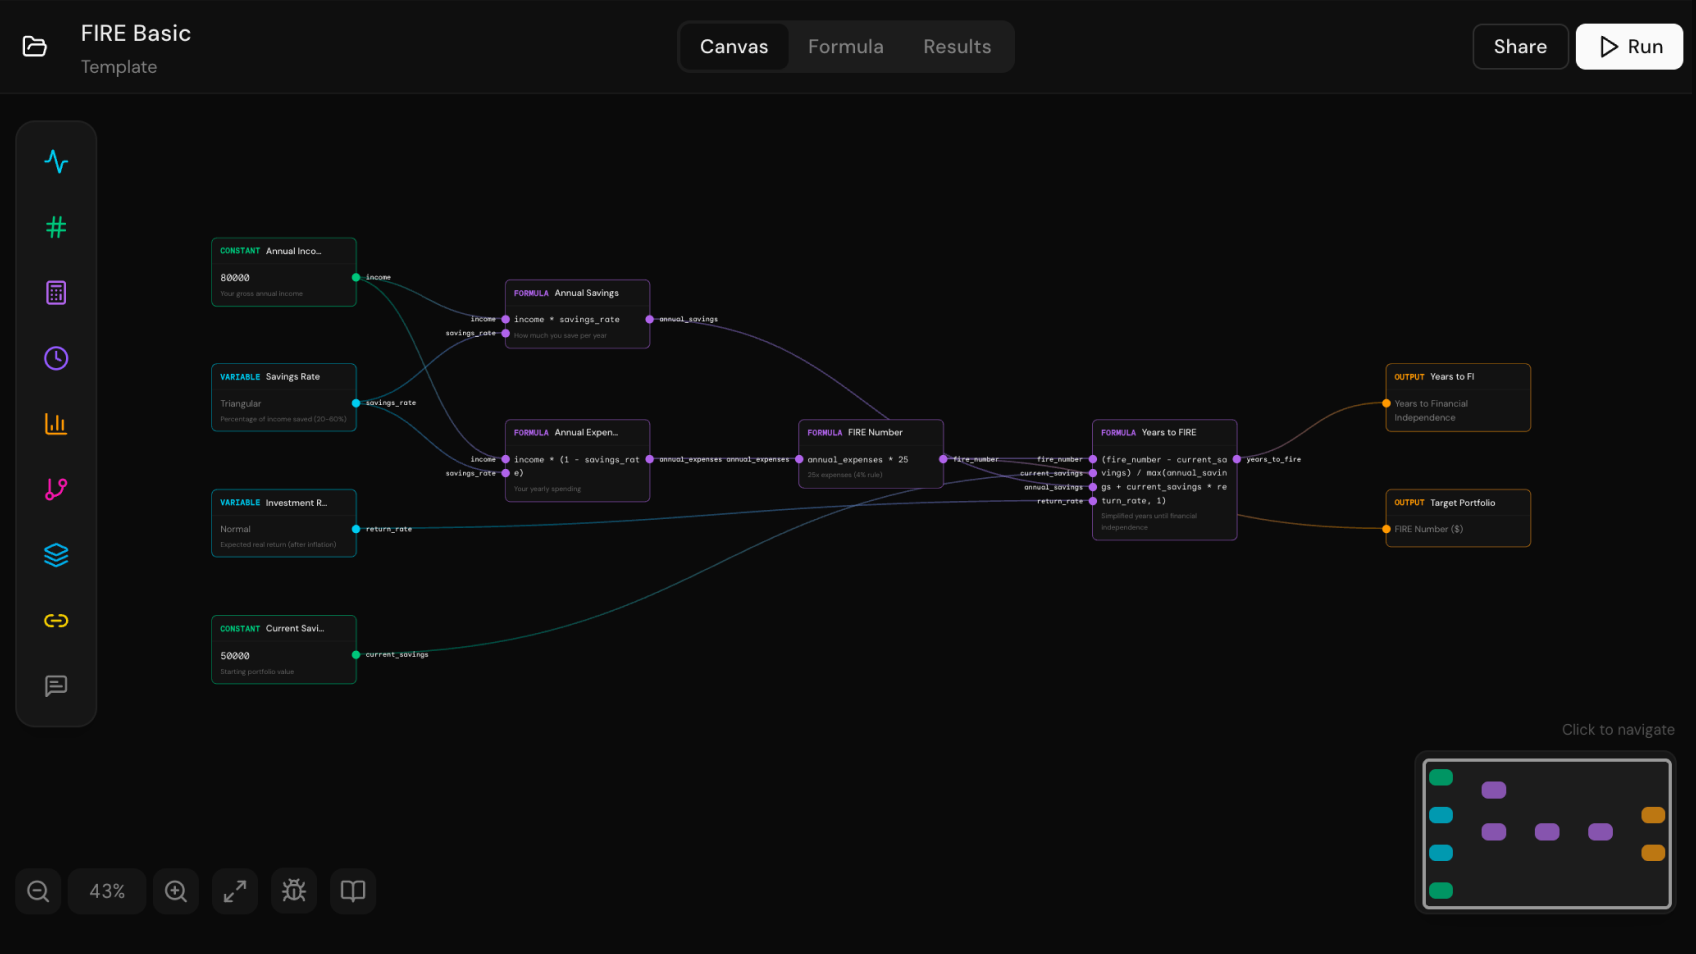
1. Add blocks
Start with Variable blocks for uncertain inputs, Formula blocks for calculations, and Output blocks to collect results.
2. Connect blocks
Drag from an output port (right side) to an input port (left side). Connections define how data flows through your model.

3. Run the simulation
Click Run to execute thousands of iterations. Each iteration samples from your distributions and computes the outcomes.
4. Analyze results
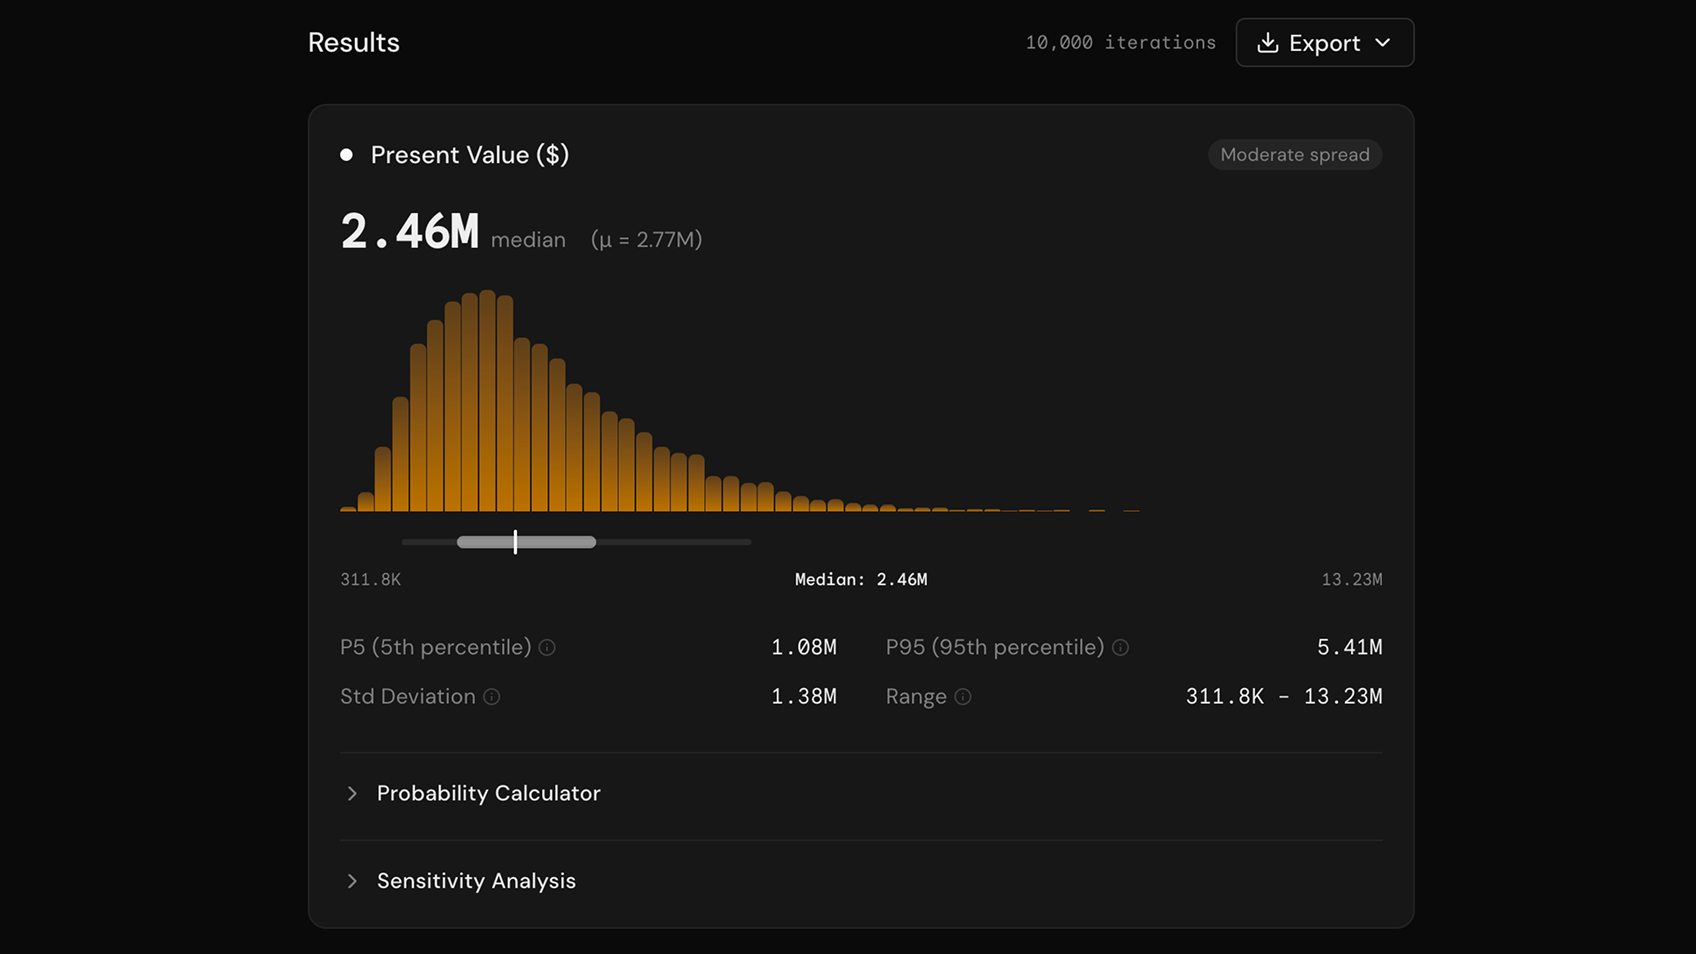
View histograms, statistics, sensitivity analysis, and probability calculations in the Results tab.
Tips
Start with templates. Browse the library to see working examples. When you edit a template, Carlo automatically creates your own copy—just start building.
Choose distributions wisely. Use Normal for symmetric data, Triangular when you have expert estimates (min, likely, max), Log-Normal for positive-only values with right skew, and Beta for probabilities between 0 and 1.
Check sensitivity analysis. After running, the tornado chart shows which inputs have the greatest impact on your outputs. Focus refinement efforts on high-impact variables.
Use keyboard shortcuts. Quick-add with V for Variable, F for Formula, O for Output. Hold Space and drag to pan.
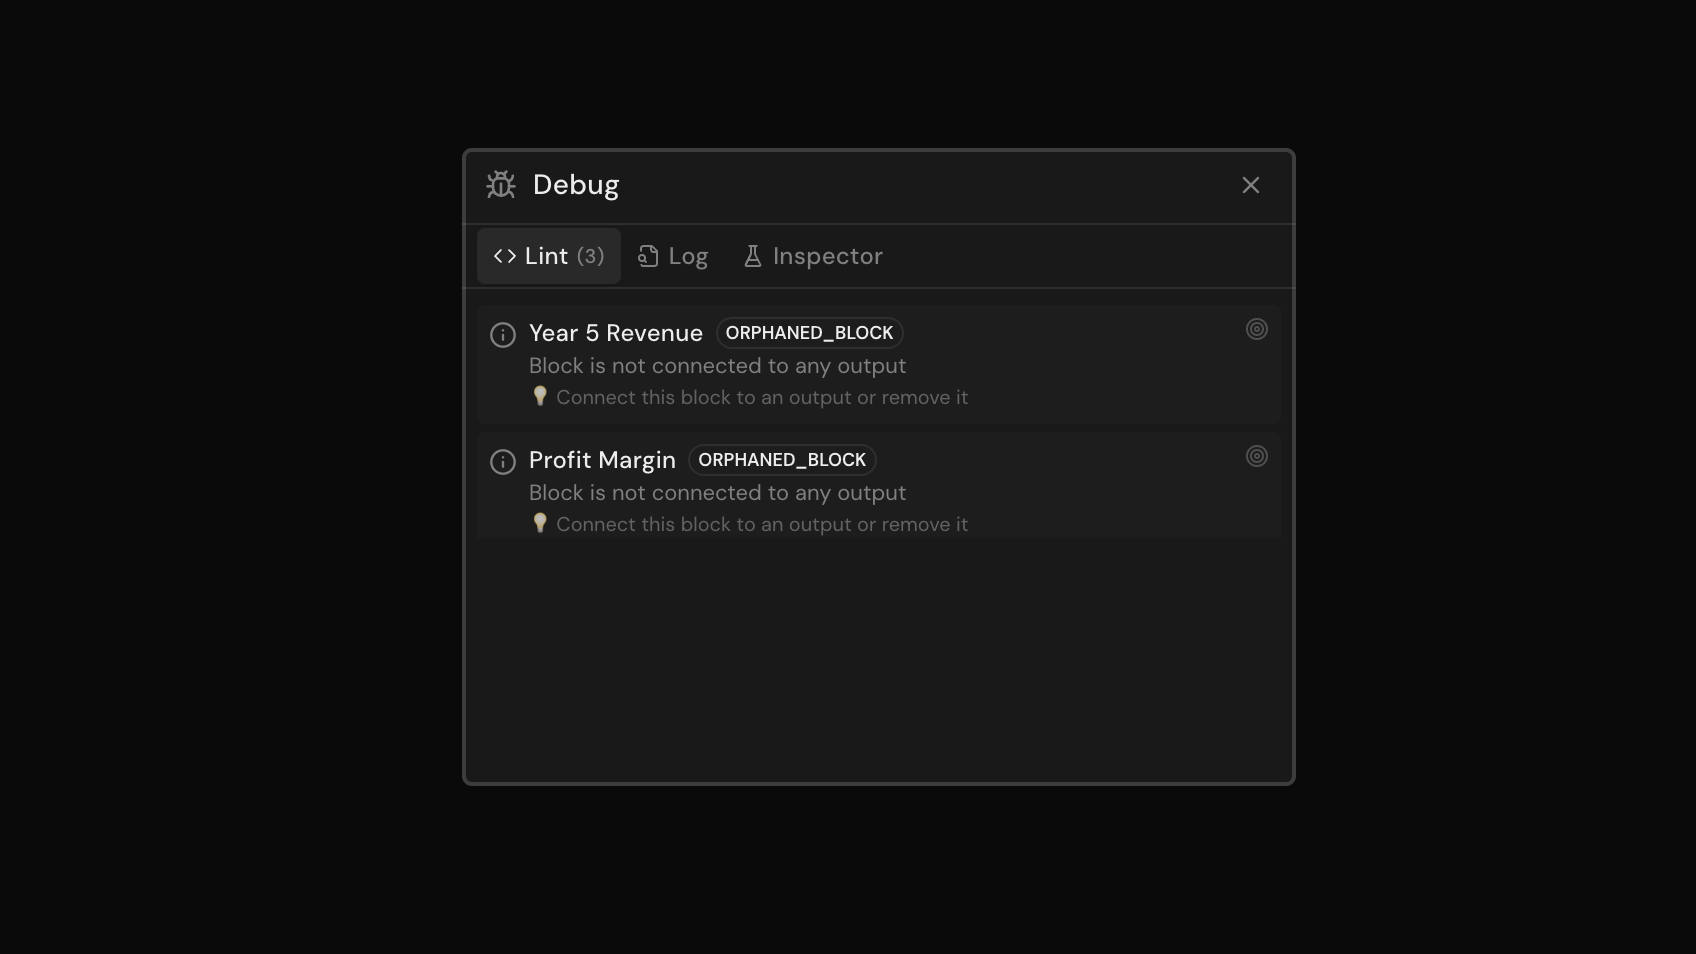
Validate before running. Open the debug panel to catch unconnected blocks, circular dependencies, or missing inputs.